Working with the multimodal analytics team, I produced a web portal for managers, analysts, and inspectors to use data science and visualization to analyze, compare and predict transportation trends in aviation, marine, rail, surface, and multimodal.
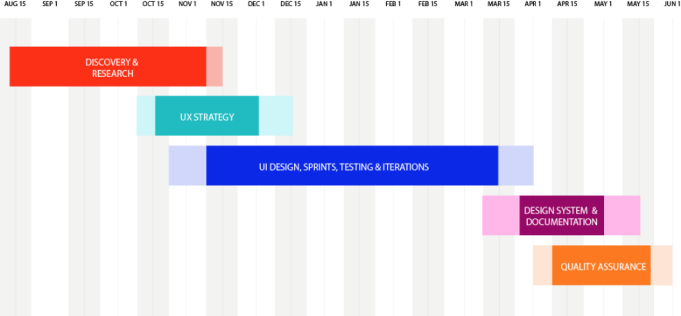
This dashboard-oriented portal uses a Power BI and HTML/CSS framework with custom visuals. The UX process included persona design, user flow, mood boards, static mockups, wireframes, prototyping in low and high fidelity, and end-user testing.
We transformed disparate data collections into an informational, user-friendly, story-driven analytical tool.
As the primary user of this product, Executives must be able to navigate to emergency notifications easily and get a quick summary and insights on the situation.

The content in this project was very data-heavy. To facilitate this, we integrated Power BI into a custom HTML/CSS experience to find the best balance between design and up-to-date data.


The pilot for this project was aviation, but we had to consider how the product would expand with other transportation types and a growing list of features. Easily adjustable navigation was the solution.


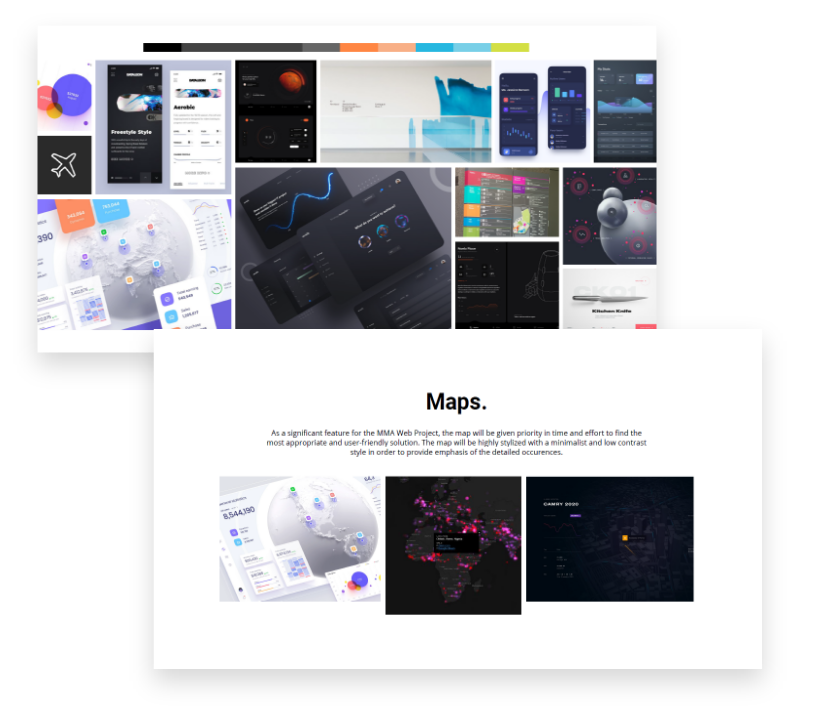
Content needed to work at a high level for executives and at a very detailed level for Analysts. We built a persona-driven dashboard experience with default module sets for each end user.
Data visualization was an integral part of this project. We ensured the data was presented in digestible and intuitive formats that provided context through simple visualizations.

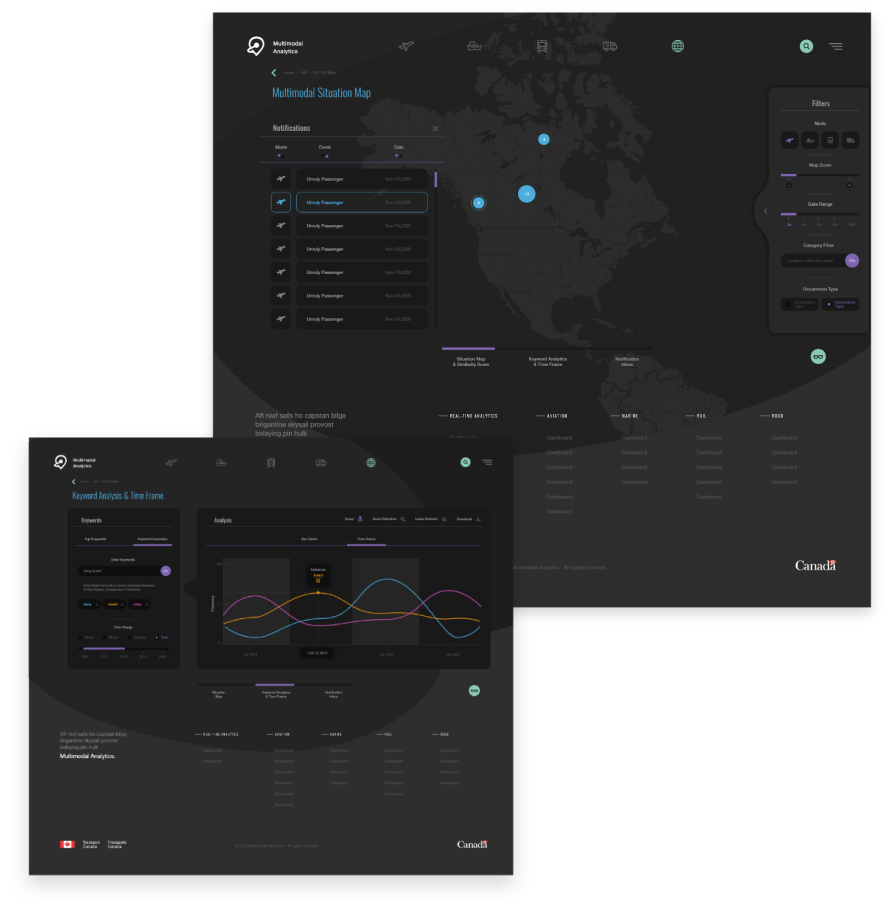

The multimodal analytics portal project was a successful effort to use data science and visualization to improve decision-making and drive business results in the transportation industry.
By applying UX best practices and developing a dashboard-oriented portal with a focus on user-friendliness and storytelling, we were able to create a tool that was well-received by managers, analysts, and inspectors.
The resulting portal, which was built using a combination of Power BI and HTML/CSS with custom visuals, demonstrated the value of investing in UX design and the benefits of using data-driven approaches to analyze, compare, and predict trends in aviation, marine, rail, surface, and multimodal transportation.
